NAME
mimedefang-dashboard - live web console for the MIMEDefang mail flow
SYNOPSIS
mimedefang-dashboard [options]
Options:
  -l, --listen ADDR:PORT  HTTP listen address (default 127.0.0.1:8689)
  -s, --mx-socket PATH    multiplexor control socket, or "none"
  -f, --feed PATH         event feed datagram socket, or "none"
      --feed-mode MODE    permissions of the feed socket (default 0660)
  -i, --interval SECS     multiplexor polling interval (default 2)
      --history N         recent events kept in memory (default 5000)
      --state FILE        save aggregated data to FILE across restarts
      --state-interval S  seconds between state saves (default 300)
      --stale SECS        warn when no event arrived for SECS (default 900)
      --spam-event NAME   event whose first value is a spam score (default spam)
      --ml-events LIST    events whose first value is an ML confidence
                          (default ml_spam,ml_not_spam,ml_uncertain_spam,
                          ml_phishing,ml_not_phishing,ml_uncertain_phishing);
                          the Spam & ML view shows them in this order;
                          "none" or an empty list hides the ML charts
                          an event logged without a value is counted
                          but gets no histogram
      --events LIST       events that get the first chart colors, in order
                          (default mail_out,spam,mail_in)
      --top-cap N         keys kept per top-N counter slice (default 300)
      --anonymize         drop subjects and mask local parts
      --allow-host NAME   accepted HTTP Host header (repeatable)
  -p, --pidfile FILE      write process id to FILE
  -d, --daemon            detach from the terminal (implies --syslog)
      --syslog[=FACILITY] log to syslog instead of stderr (default mail)
  -q, --quiet             no log output
  -h, --help              brief help
      --man               full documentation
  -v, --version           print version
SCREENSHOTS
Sample data; see also the mimedefang-dashboard snippet.
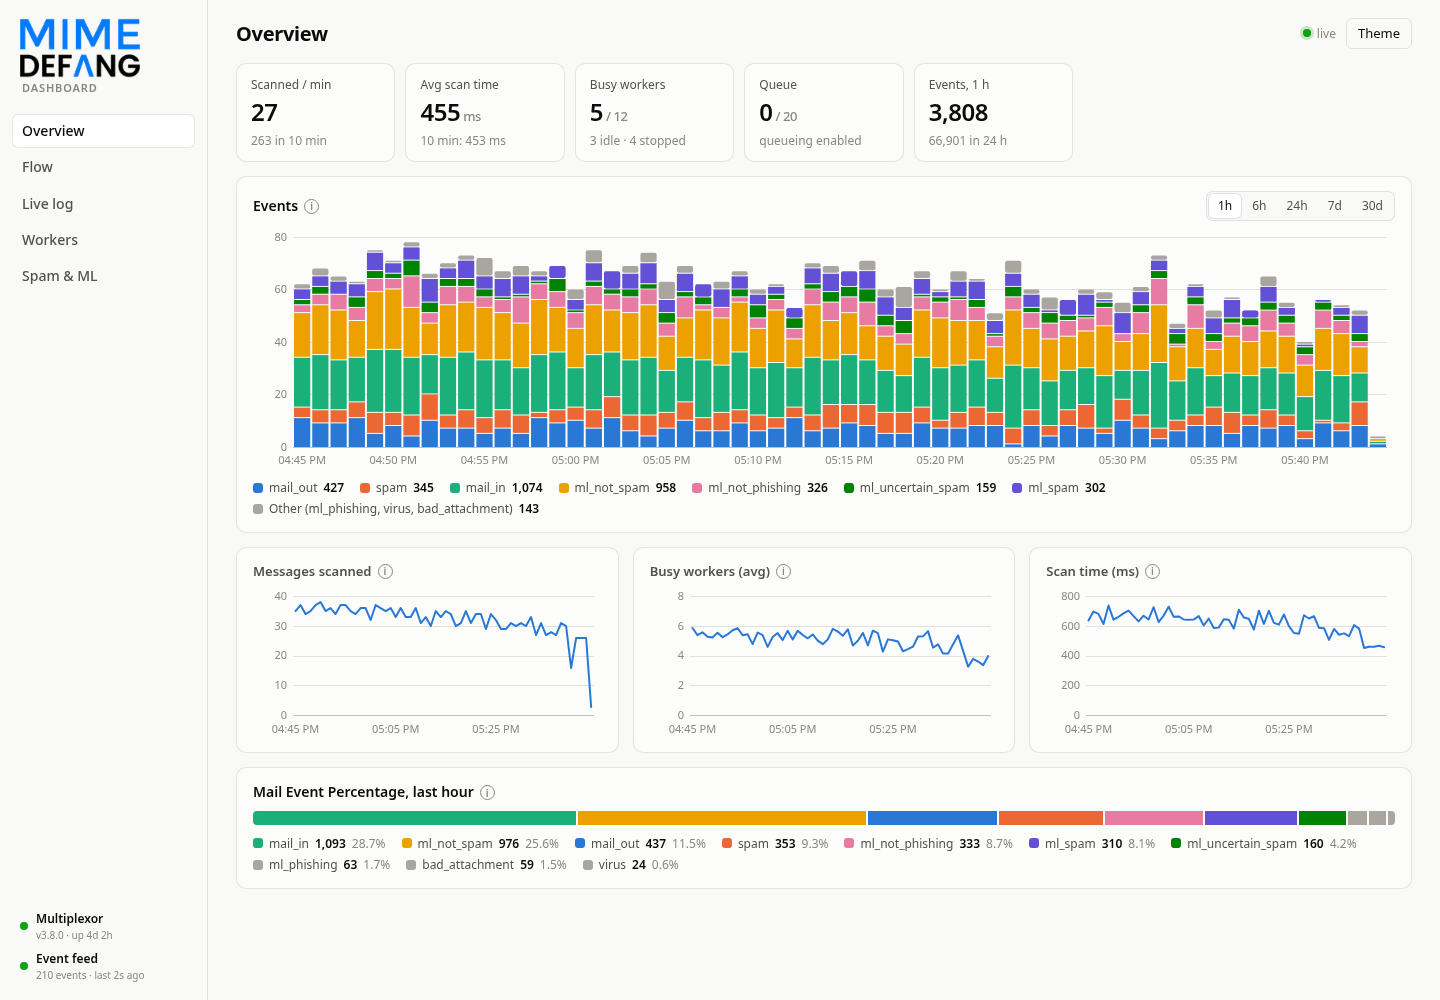
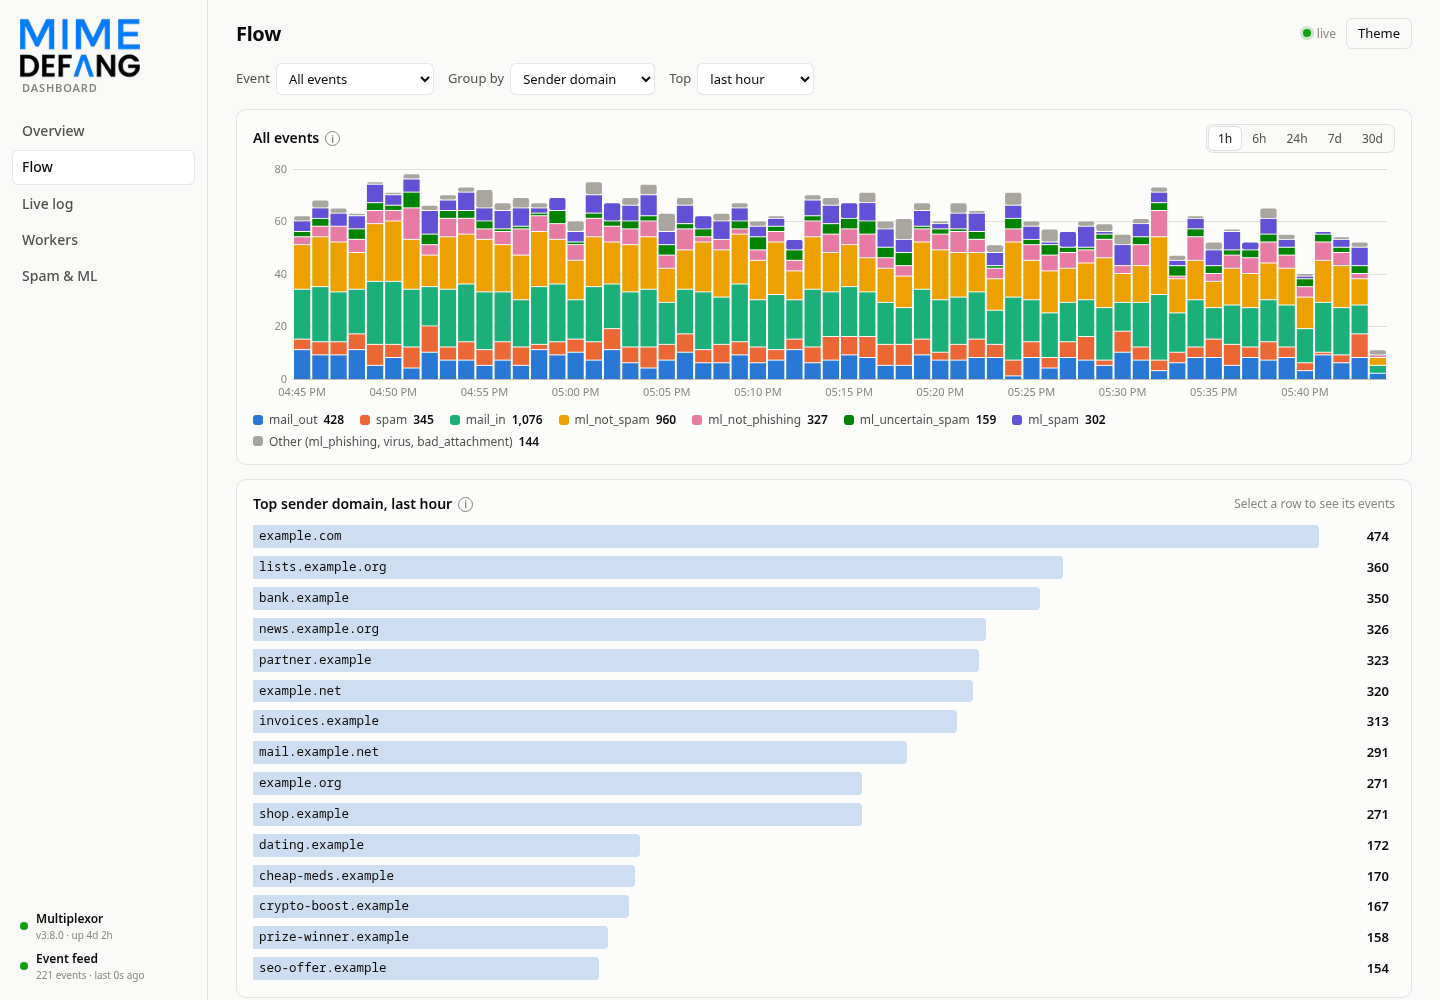 Flow |
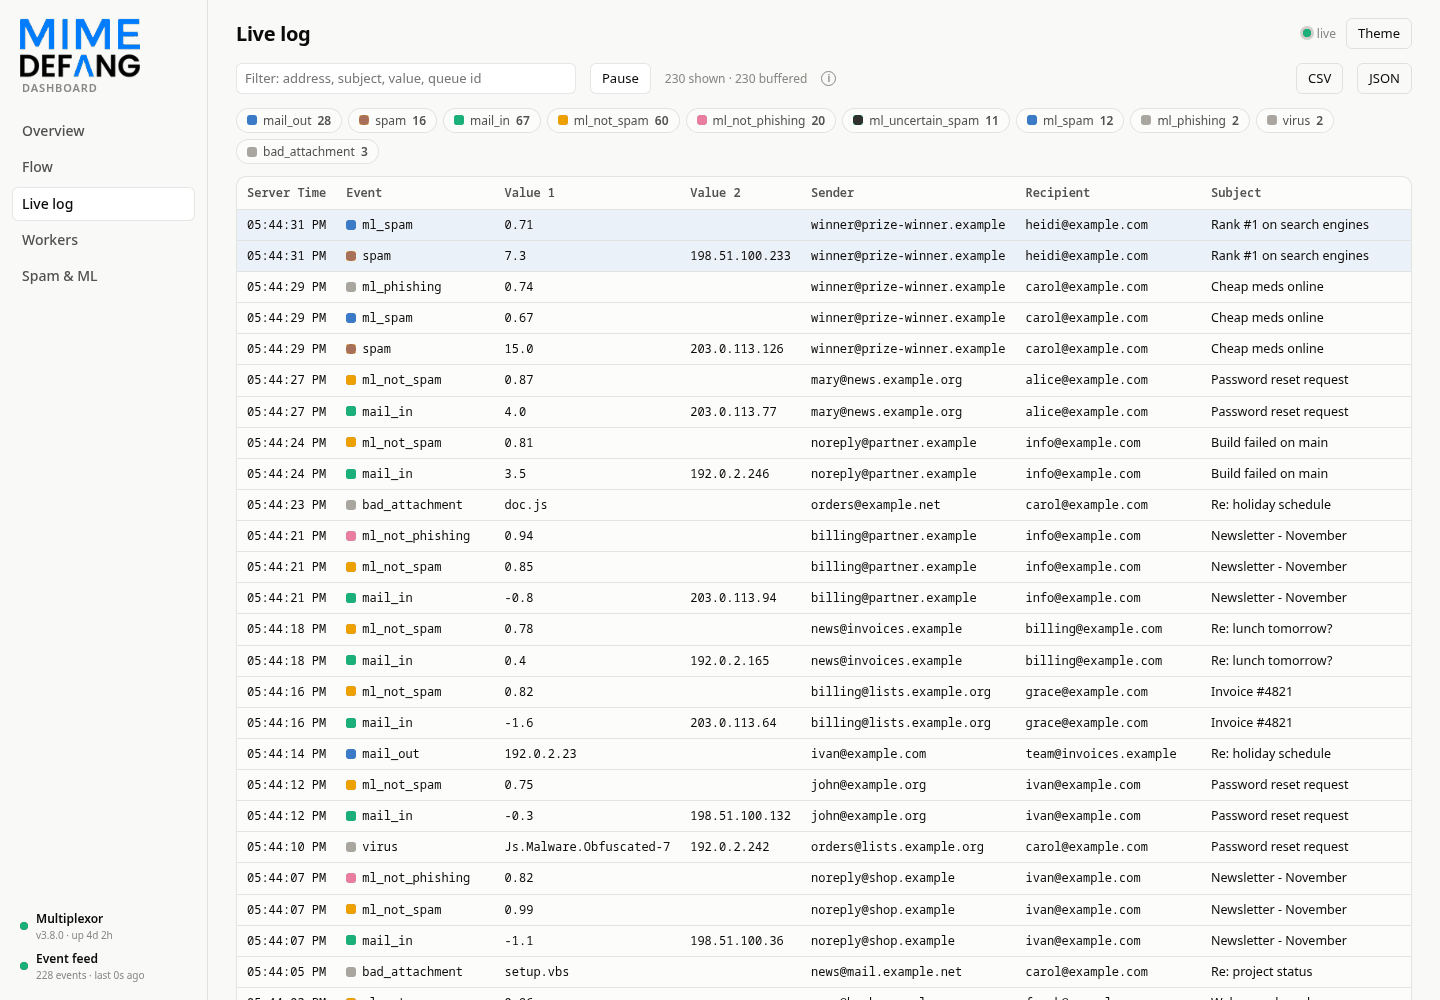 Live log |
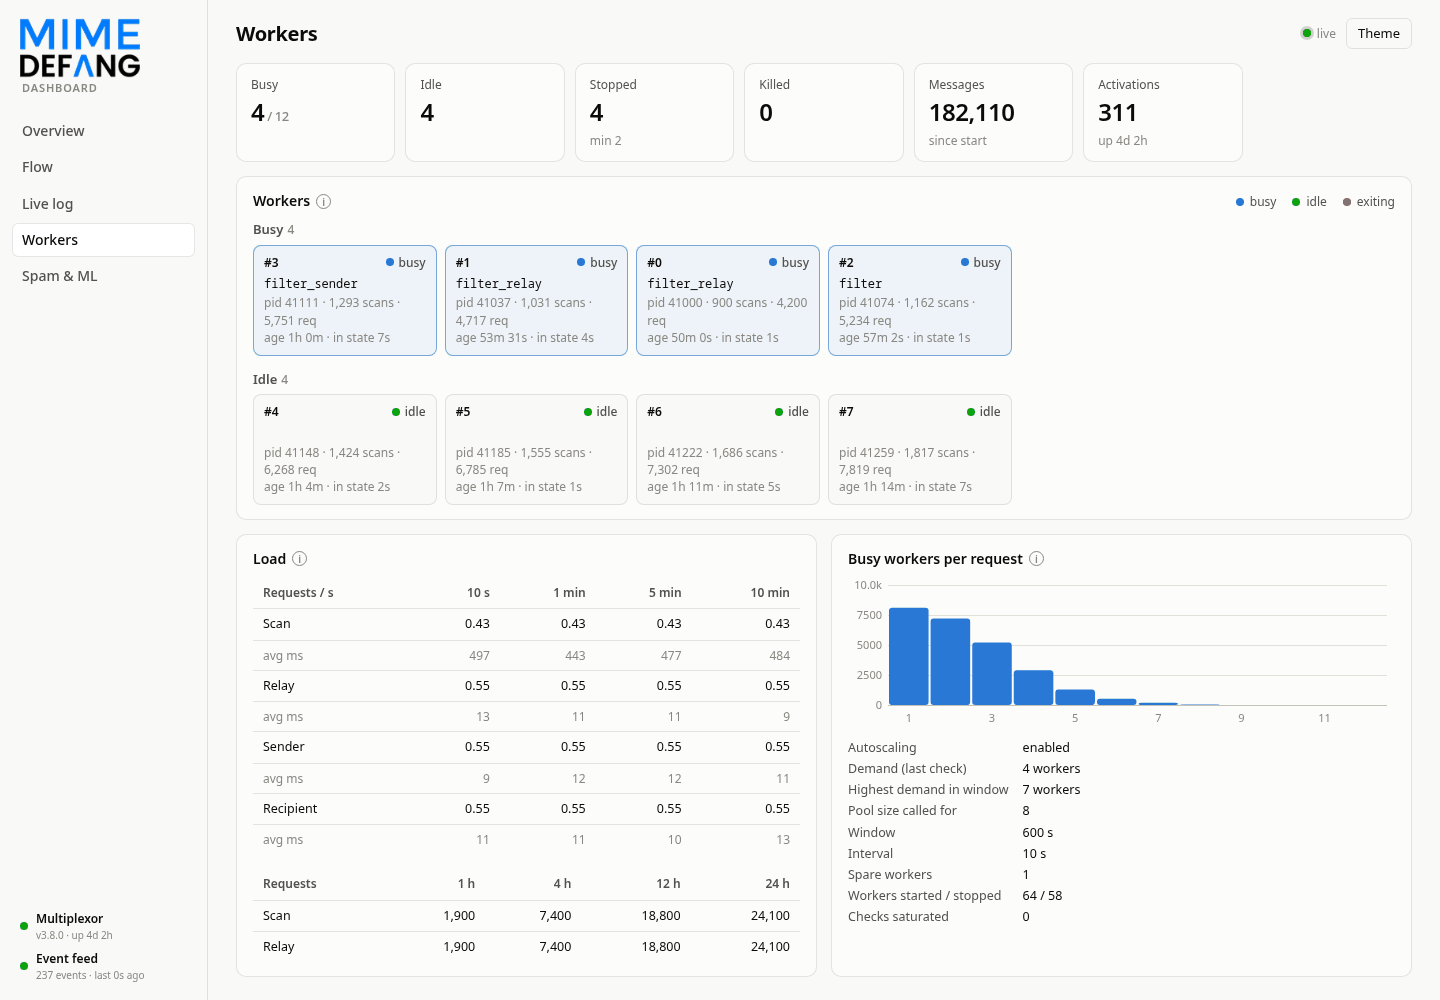 Workers |
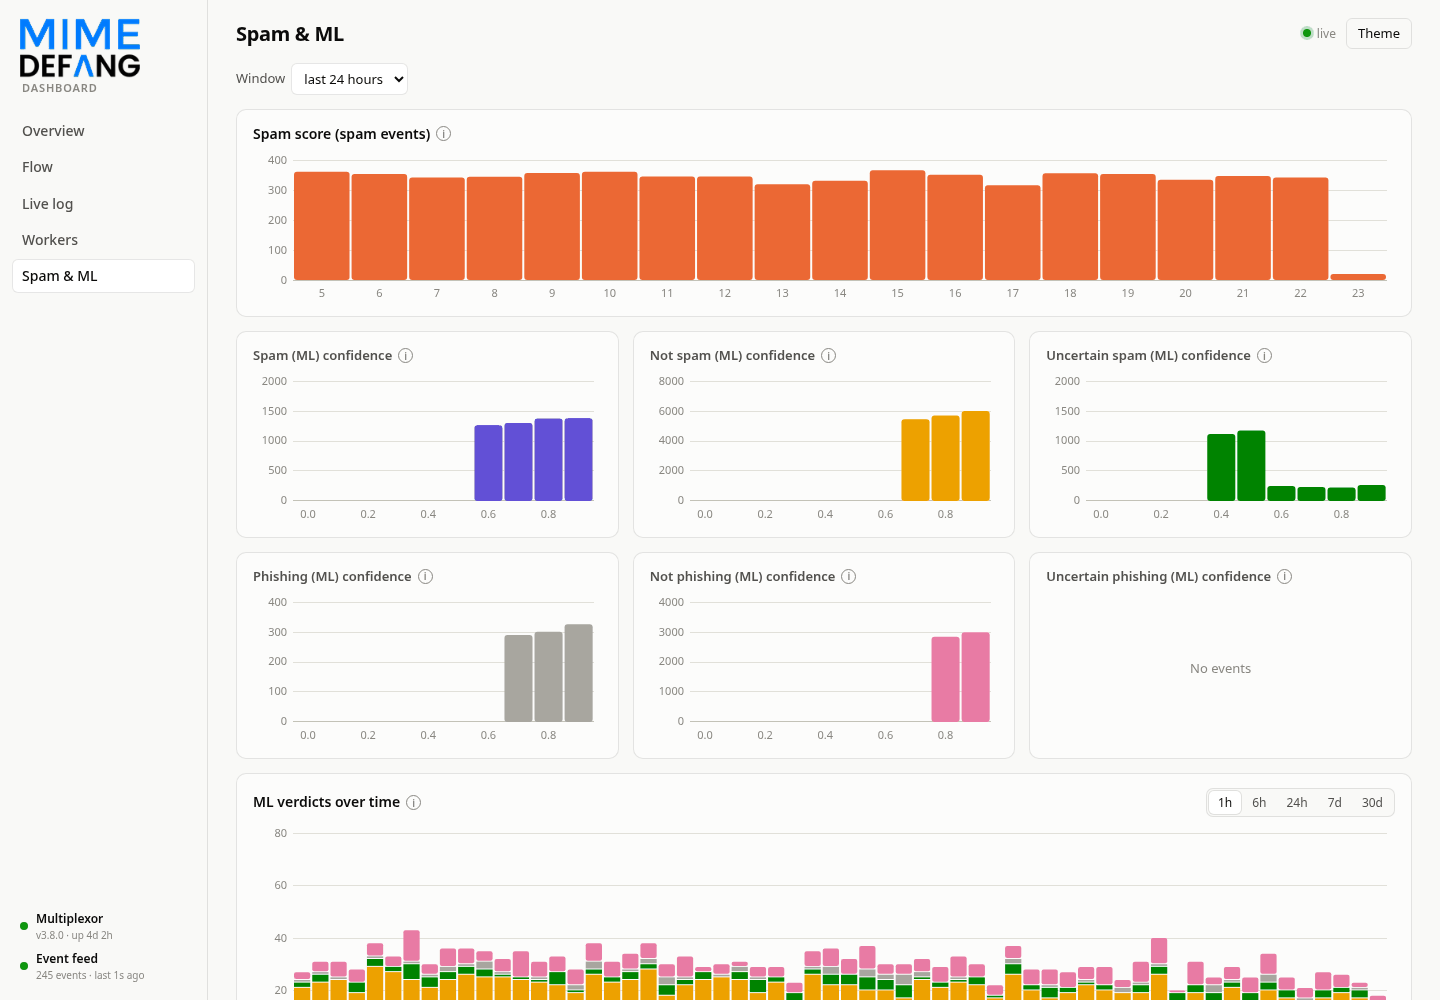 Spam & ML |
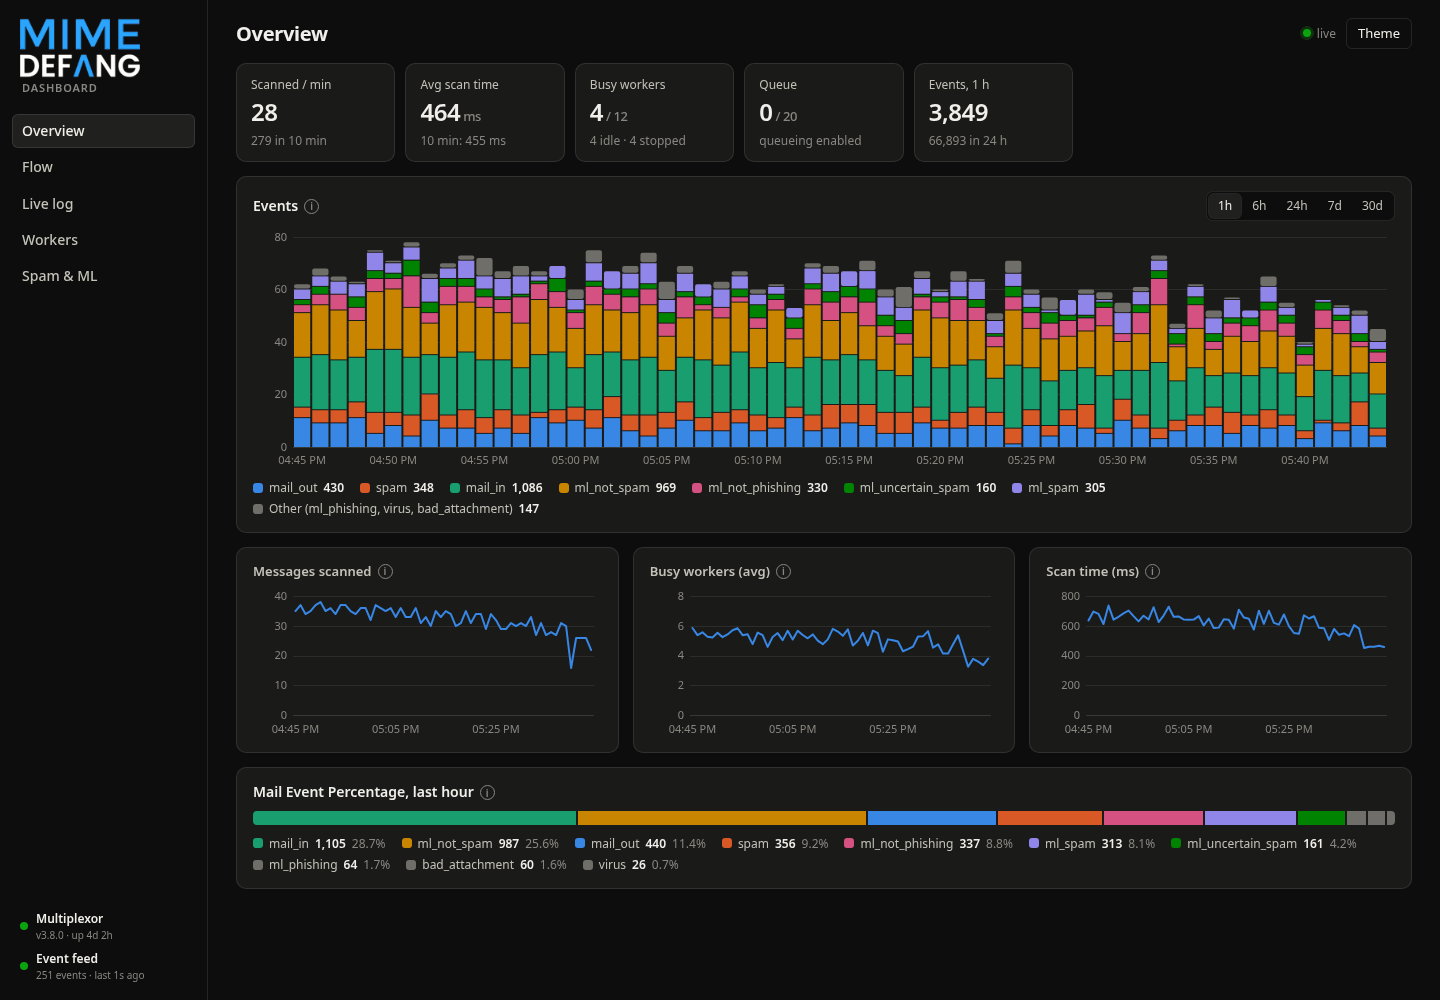 Dark theme |
DESCRIPTION
mimedefang-dashboard shows what MIMEDefang is doing right now: message and event throughput, the state of every worker, scan latency, top senders, recipients and domains, spam and machine-learning score distributions, and a live, searchable stream of events. It runs its own small HTTP server and needs no web server, no database and no access to the mail log. All data is kept in memory; with --state the aggregates survive a restart.
The dashboard refuses to run as root. Run it as the MIMEDefang user (defang), which can read the multiplexor socket and create the feed socket in the spool directory.
Data sources
-
Multiplexor
Every --interval seconds the dashboard sends jsonsnapshot to the multiplexor control socket (the same socket md-mx-ctrl uses, or the unprivileged one given to mimedefang-multiplexor -a). With an older multiplexor it falls back to the status, load and histo commands.
-
Event feed
The filter sends every md_graphdefang_log event to a UNIX datagram socket. Enable it in
mimedefang-filter:sub filter_initialize { md_graphdefang_feed_enable(); }or call it at the top level of the filter. The full form is
md_graphdefang_feed_enable($socket_path, $enum_recips);Both arguments are optional:
-
$socket_path
The absolute path of the dashboard socket. It must match --feed. The default is
/var/spool/MIMEDefang/mimedefang-dashboard.sock. A relative path is ignored with a warning, and the default is used. -
$enum_recips
If true (the default), a message with several recipients produces one event per recipient.
Delivery never blocks the filter. Events are dropped while the dashboard is not running.
-
HTTP interface
The user interface is served at /. The JSON API is:
-
/api/summaryCounters, source health and alerts.
-
/api/workersThe last multiplexor snapshot: worker list with status tags, load, histogram and autoscale state (see jsonautoscale in md-mx-ctrl(8)). When the autoscaler reports that the demand reached the maximum number of workers with requests waiting, an alert suggests raising -x for the next 10 minutes.
-
/api/series?range=1h|6h|24h|7d|30dEvents per time step plus multiplexor samples.
-
/api/top?dim=DIM&window=1h|24h&event=EVENT&n=NTop values for DIM: sender, sender_domain, rcpt, rcpt_domain, value1 or value2. Counts are approximate when there are many distinct values.
-
/api/events?q=TEXT&event=EVENT&id=ID&limit=NRecent events, newest first.
-
/api/scores?window=24h|7dSpam score and ML confidence histograms.
-
/api/streamServer-Sent Events: events (new events) and tick (summary).
-
/api/export?what=events|series&fmt=csv|jsonDownload events or series.
-
/metricsPrometheus text format. The mimedefang_autoscale_* metrics give the demand at the last check and the highest in the window, the pool size called for, and counters of workers started and stopped and of saturated and blocked checks.
SECURITY
The dashboard listens on 127.0.0.1 by default and is read-only. When it
listens on a loopback address only localhost, 127.0.0.1 and ::1
are accepted as HTTP Host, which defeats DNS rebinding; add names with
--allow-host. It has no authentication of its own: to reach it from
other hosts, put it behind a reverse proxy that handles TLS and
authentication. Subjects and addresses are shown; use --anonymize where
that is not acceptable.
Reverse proxy with Apache httpd
Keep the dashboard on its default loopback address and let Apache httpd handle TLS and authentication. You need mod_ssl, mod_proxy, mod_proxy_http, mod_headers, mod_auth_basic and mod_authn_file. A minimal virtual host:
<VirtualHost *:443>
    ServerName dashboard.example.com
    SSLEngine on
    SSLCertificateFile    /etc/pki/tls/certs/dashboard.crt
    SSLCertificateKeyFile /etc/pki/tls/private/dashboard.key
    Header always set Strict-Transport-Security "max-age=31536000"

    ProxyRequests     Off
    ProxyPreserveHost Off
    ProxyTimeout      3600
    ProxyPass         /api/stream http://127.0.0.1:8689/api/stream flushpackets=on
    ProxyPass         /           http://127.0.0.1:8689/
    ProxyPassReverse  /           http://127.0.0.1:8689/

    <Location />
        AuthType Basic
        AuthName "MIMEDefang dashboard"
        AuthUserFile /etc/httpd/mimedefang-dashboard.htpasswd
        Require valid-user
    </Location>

    # Optional: let a Prometheus server scrape without a password
    <Location /metrics>
        Require ip 192.0.2.10
    </Location>
</VirtualHost>
Create the password file with:
htpasswd -c /etc/httpd/mimedefang-dashboard.htpasswd admin
Notes:
- The user interface uses absolute URLs, so the dashboard must be served at
the root of a virtual host, not under a sub-path such as
/dashboard/. - With ProxyPreserveHost Off (the Apache default) the dashboard sees
127.0.0.1:8689as Host and needs no extra option. With ProxyPreserveHost On, start it with --allow-host dashboard.example.com. /api/streamis a Server-Sent Events stream: flushpackets=on and a long ProxyTimeout keep the live view from stalling or being cut off.- Any other Apache authentication module, such as mod_auth_openidc or
mod_authnz_ldap, can replace Basic authentication. Add Require ip
to restrict access further. Drop the
/metricsblock to keep the Prometheus endpoint behind authentication too. - Make sure port 8689 cannot be reached from other hosts, for example with a firewall rule, if the dashboard listens on a non-loopback address.
SIGNALS
SIGTERM and SIGINT save the state file and exit. SIGHUP saves the state file.
SEE ALSO
mimedefang-filter(5), mimedefang-multiplexor(8), md-mx-ctrl(8), httpd(8)