How do I watch the mail flow live with mimedefang-dashboard?
mimedefang-dashboard (MIMEDefang 3.8+) is a live web
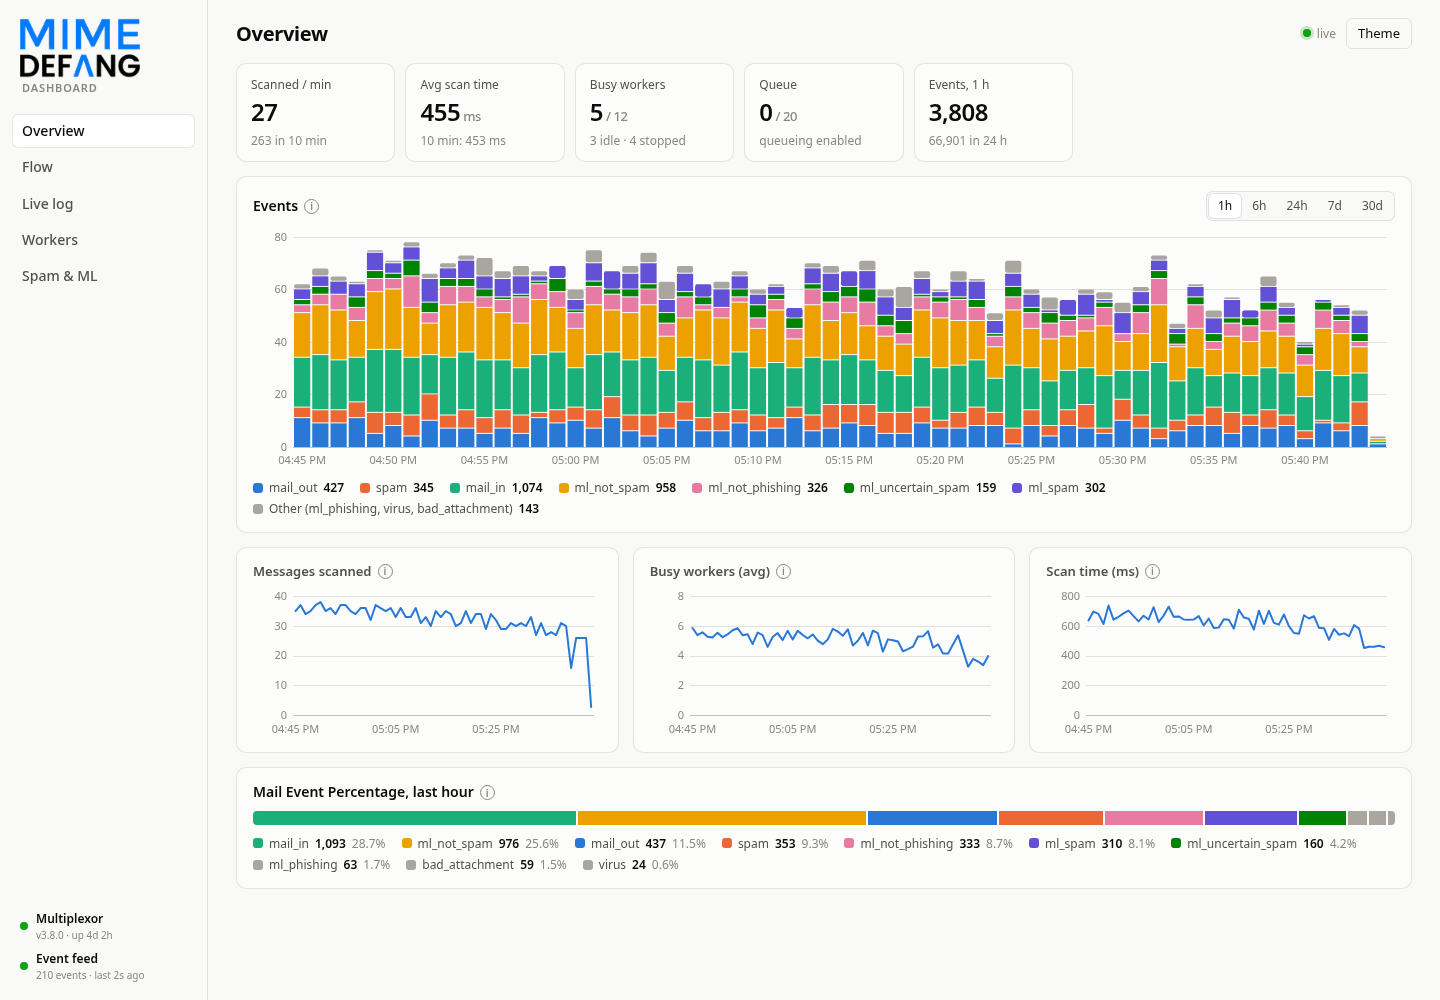
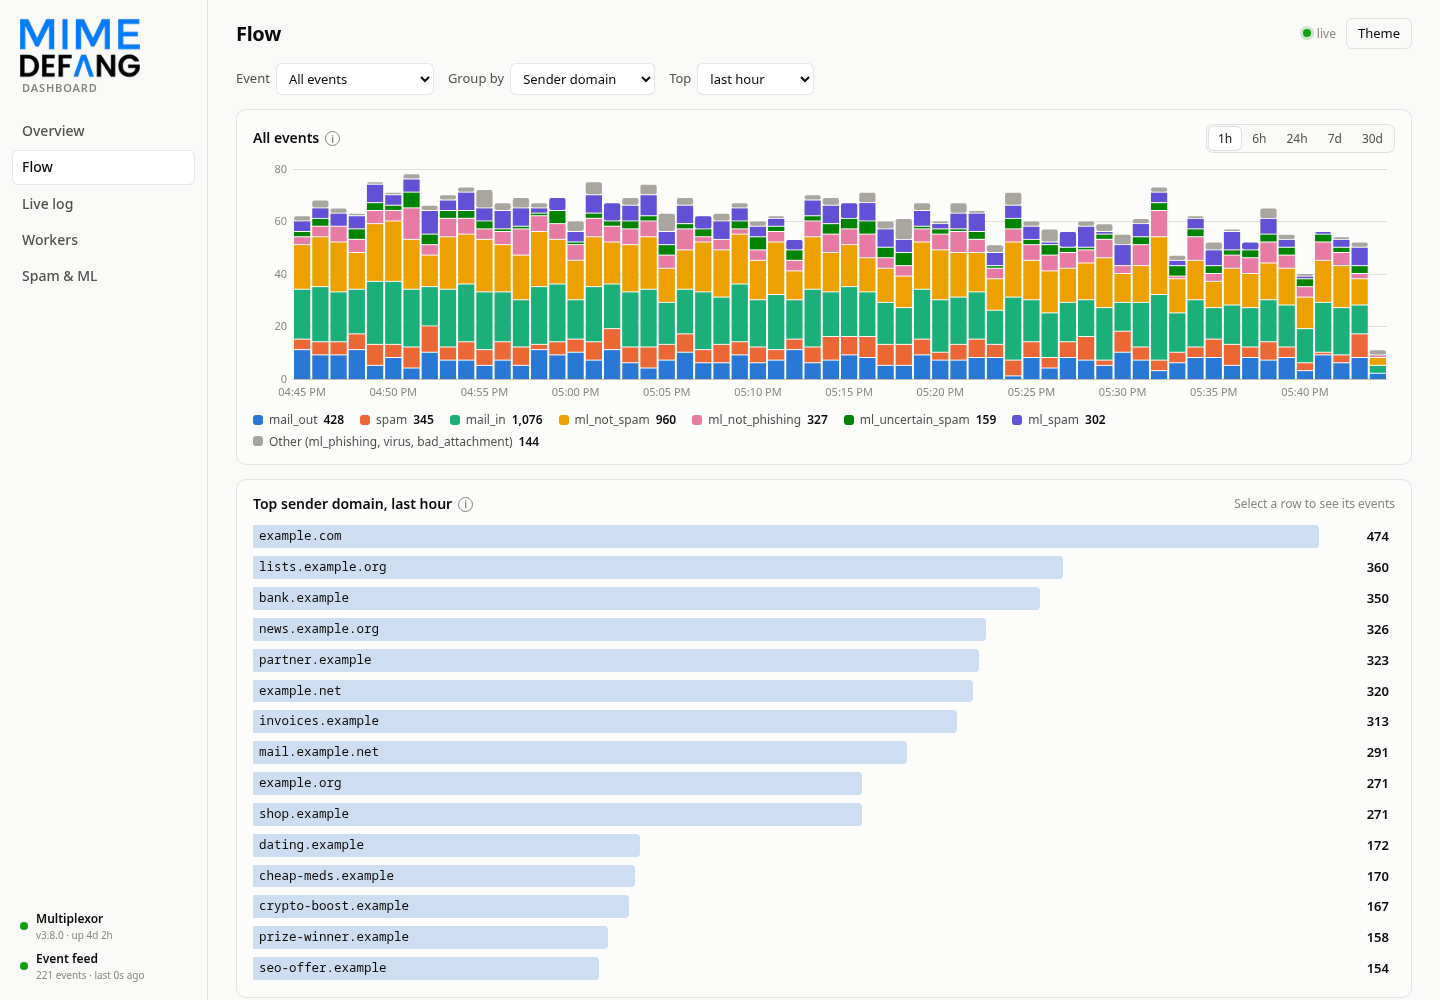
console for your mail flow: throughput by event, top senders, recipients and domains, a
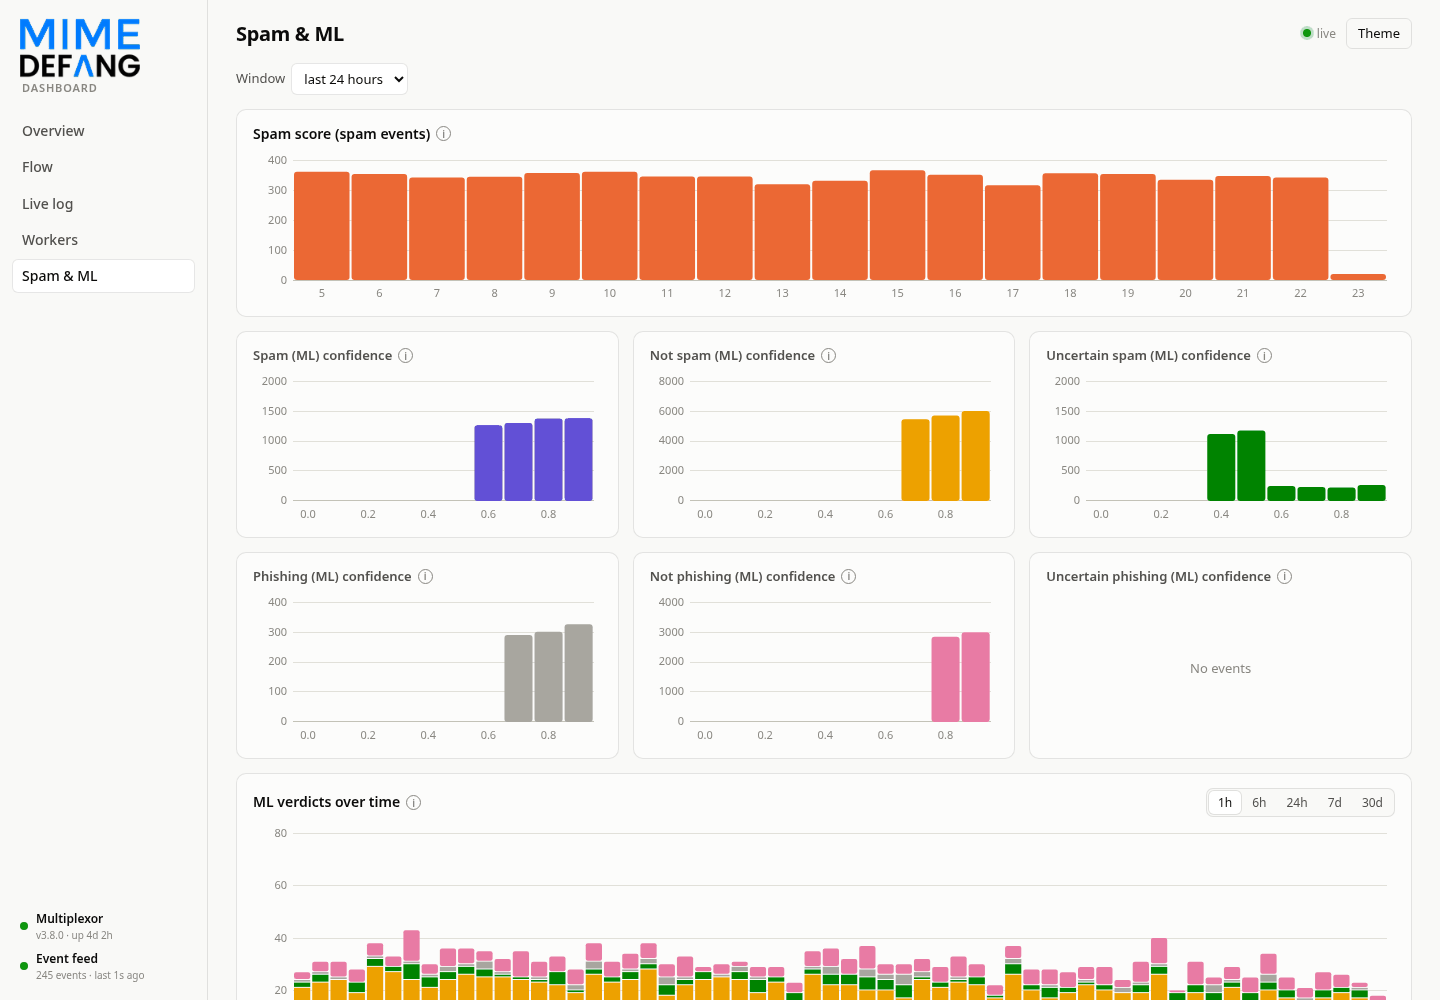
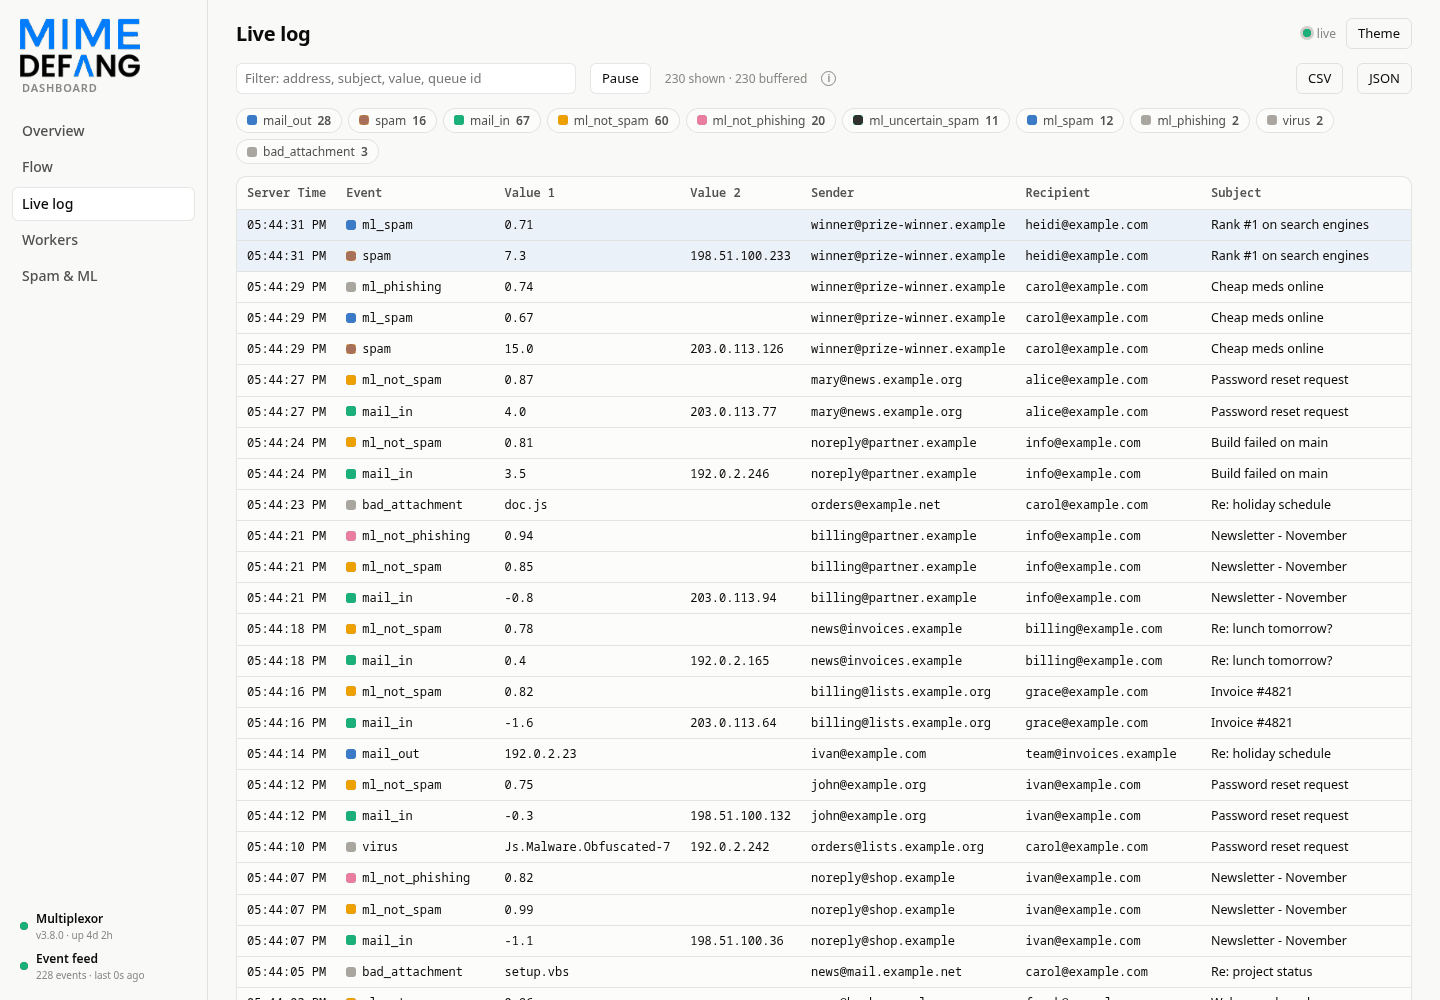
live event log, the multiplexor workers, spam and ML score distributions, and Prometheus
metrics at /metrics. It runs its own HTTP server, keeps its data in memory, never reads
the mail log and refuses to run as root.
It shows the events your filter logs with md_graphdefang_log; send them to it with
md_graphdefang_feed_enable():
# At the top of mimedefang-filter
md_graphdefang_feed_enable();           # socket in the spool directory
# md_graphdefang_log_enable('mail', 1); # optional: keep logging to syslog too

sub filter_end {
    my ($entity) = @_;

    my ($hits, $req, $names, $report) = spam_assassin_check();
    if ($hits >= $req) {
        # $per_message = 2: one line with all the recipients separated by ";"
        md_graphdefang_log('spam', $hits, $RelayAddr, undef, 2);
    } else {
        md_graphdefang_log('mail_in', $hits, $RelayAddr, undef, 2);
    }
}
Delivery never blocks: when the dashboard is not running the events are dropped, so it can
be started and stopped at any time. Start it with the systemd unit shipped in
systemd-units/, or by hand:
mimedefang-dashboard --listen 127.0.0.1:8689 \
    --state /var/spool/MIMEDefang/dashboard.state
--state keeps the aggregated data across restarts, --anonymize drops the subjects and
masks the local parts of addresses. It listens on localhost by default: put it behind a
reverse proxy with authentication to reach it from elsewhere.
The overview (sample data):
Top senders, recipients and domains for each event:
The live event log; click a row to see all the events of a message:
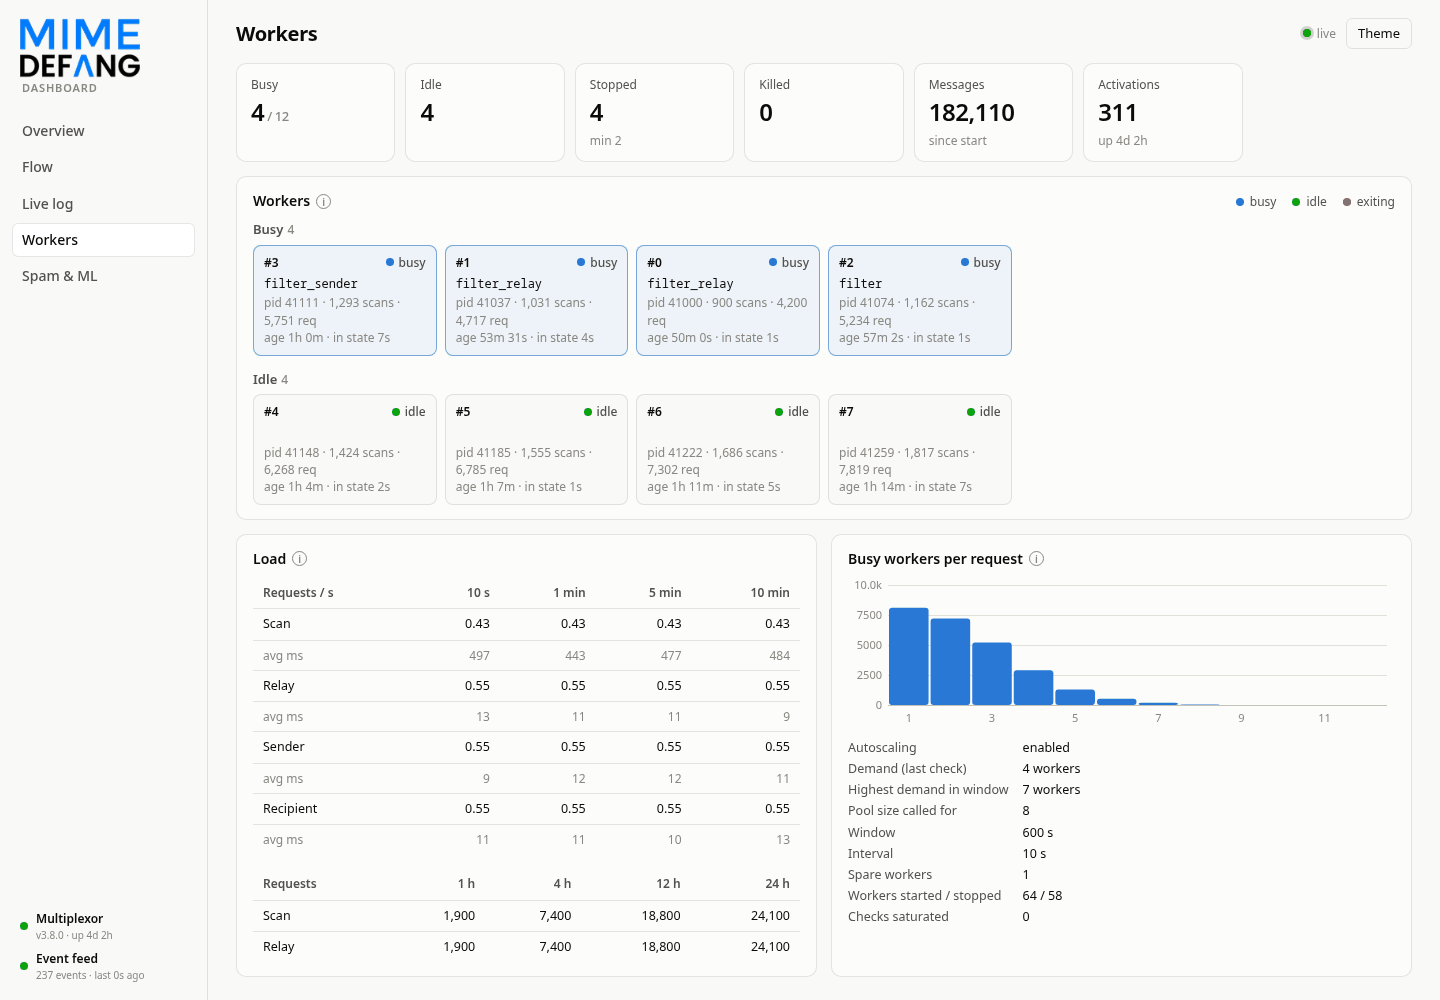
Multiplexor workers, load and autoscaler:
Spam score and ML confidence distributions: